

How to Use Screener.in Like a MicroCap Pro: Discover Hidden Gems
What 1000+ microcap screens taught me—and how you can use them to spot your own hidden gems.

Most investors open Screener.in just to quickly skim financial ratios and documents. But microcap pros? They turn Screener into a powerful scanning tool to uncover hidden gems that deliver exponential returns.
Before we proceed, I’ve made a quick detailed video on an interesting Screener Plugin that helps assess valuations more effectively—check it out, and I hope you find it useful.
So, back to the guide—here’s a simple 5-point checklist used by seasoned investors to spot high-quality microcap companies.
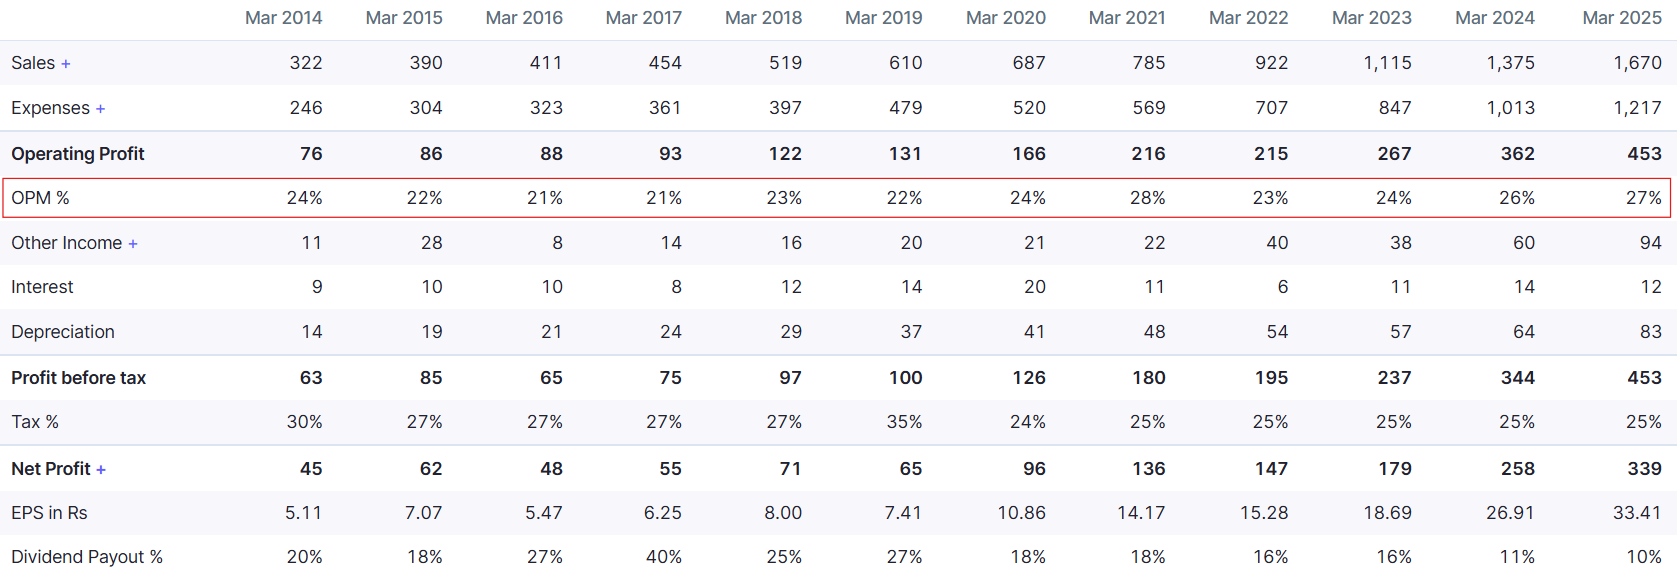
1. Focus on Rising Operating Profit Margin (OPM), not just Revenues
Many retail investors assume that rising revenue naturally leads to rising profits. But in microcaps, this can be misleading. Sometimes, companies may boost sales by cutting prices to stay competitive—hurting their margins in the process. That's why it's often more insightful to look beyond revenue and focus on Operating Profit Margin (OPM).
A consistently rising or stable OPM is a strong indicator of a company’s ability to maintain pricing power and cost control even as it grows.
Why it matters:
Operating Leverage: When revenue increases faster than fixed costs like rent and salaries, each additional unit sold contributes more to profit—leading to improved margins over time. This is a key driver of margin expansion and helps sustain profitability as the business scales.
Pricing Power: OPM often signals that the company offers a differentiated product or service, has a strong brand, or operates in a niche with limited competition. Stable or improving margins in such cases reflect a durable advantage.
Real-World Example:
Poly Medicure (Polymed) has consistently maintained stable and improving margins over the past several years, thanks to its high-value medical device portfolio and strong export demand. This reflects both pricing power and efficient operations in a regulated industry.
2. Consistent ROCE - Higher than Cost of Capital for at least 3 Years
ROCE (Return on Capital Employed) measures how effectively a company generates profits from the capital it employs in the business. However, what really sets strong companies apart is not just a high ROCE in one year, but a consistently high ROCE over time—especially if it exceeds the company's Cost of Capital. This indicates that the business is not only profitable, but is creating true economic value year after year.
Why it matters:
Signals sustainable profitability.
Demonstrates management’s efficiency in deploying capital.
Real-World Example:
Dynamic Cables has steadily improved its ROCE from around 11% in FY21 to 26% in FY25. This consistent rise over five years highlights improving capital efficiency and reflects better asset utilization as well as operating discipline in a capital-intensive industry.
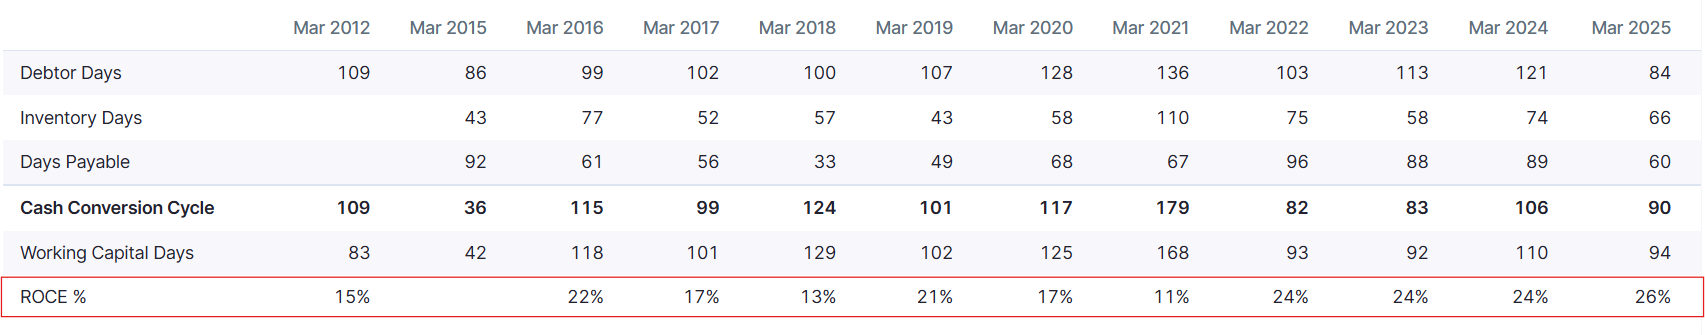
Red Flag: Avoid companies with ROCE below 12% consistently or highly volatile—it signals capital inefficiency.
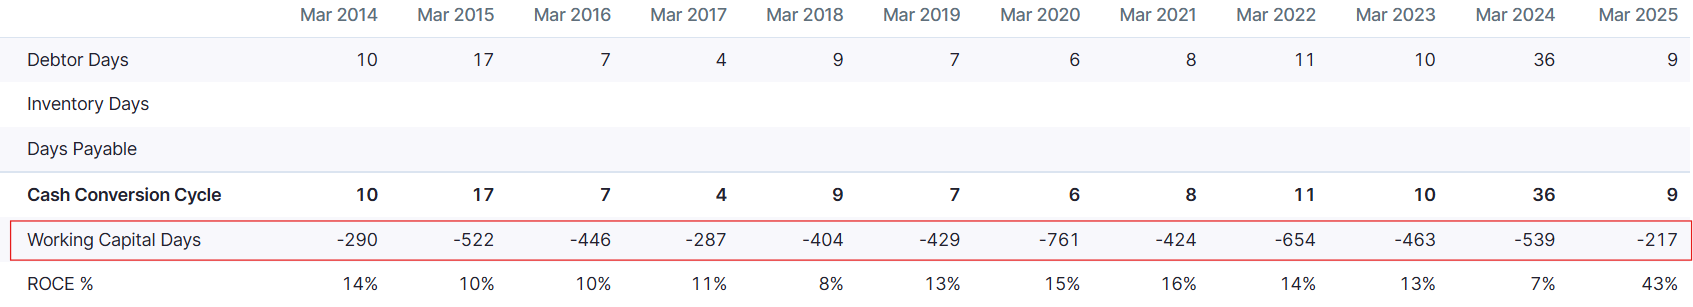
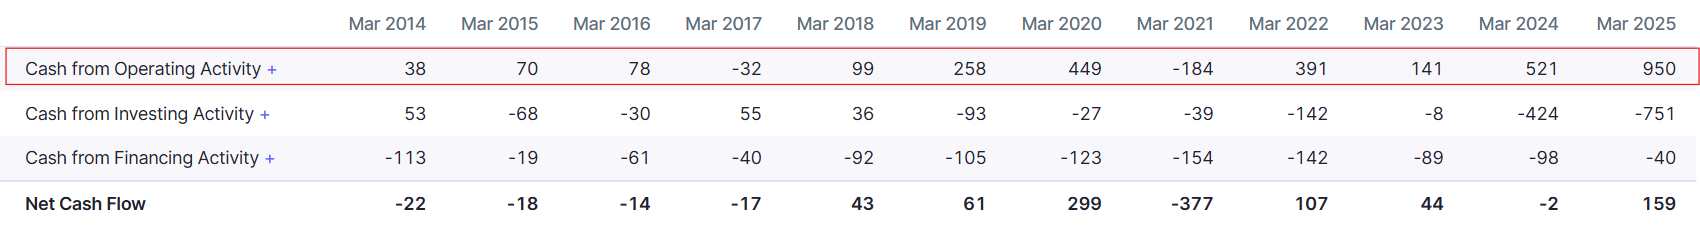
3. Negative Working Capital Paired with Positive Cash Flow
This rare combo signals strong operational efficiency—meaning the company collects cash from its customers faster than it needs to pay its suppliers. This reverse cash cycle allows the company to grow without tying up much working capital, supporting self-funded expansion and strong cash generation.
However, negative working capital isn’t possible in every industry; it’s more common in sectors like FMCG, retail, or exchanges. In general, the lower the working capital days, the better.
Why it matters:
Strong free cash flow.
Reduced external financing needs.
Increased resilience in downturns.
Real-World Example:
MCX (Multi Commodity Exchange) is a textbook example of this rare combination. It operates with negative working capital—receiving advances from clients—while consistently generating strong operating cash flows. Over the years, it has scaled operations efficiently without relying much on external funding, all while maintaining a lean working capital cycle. This structure has helped MCX remain cash-rich and highly resilient, even during volatile market phases.
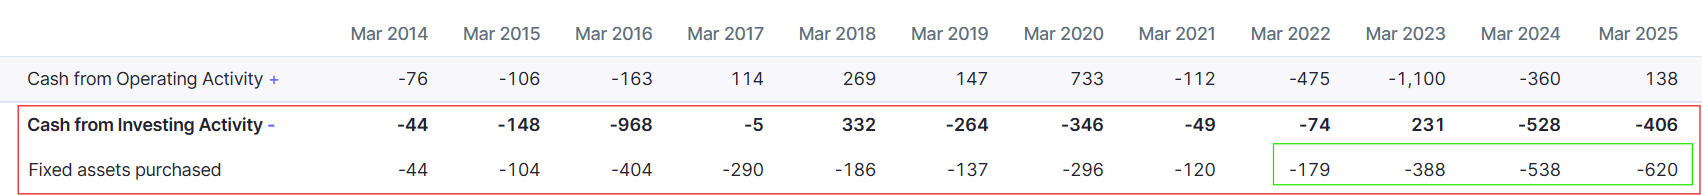
4. Sudden Debt Reduction Coupled with Rising Fixed Assets
Look for this powerful signal that the company has completed a heavy capital expenditure phase—often marked by a sharp drop in debt and a noticeable rise in fixed assets. This usually means the business has finished building capacity and is now poised to benefit from higher efficiency and profitability.
Why it matters:
Indicates new capacities are online, ready to boost profitability.
Often overlooked by investors due to temporarily depressed profits during capex.
Real-World Example:
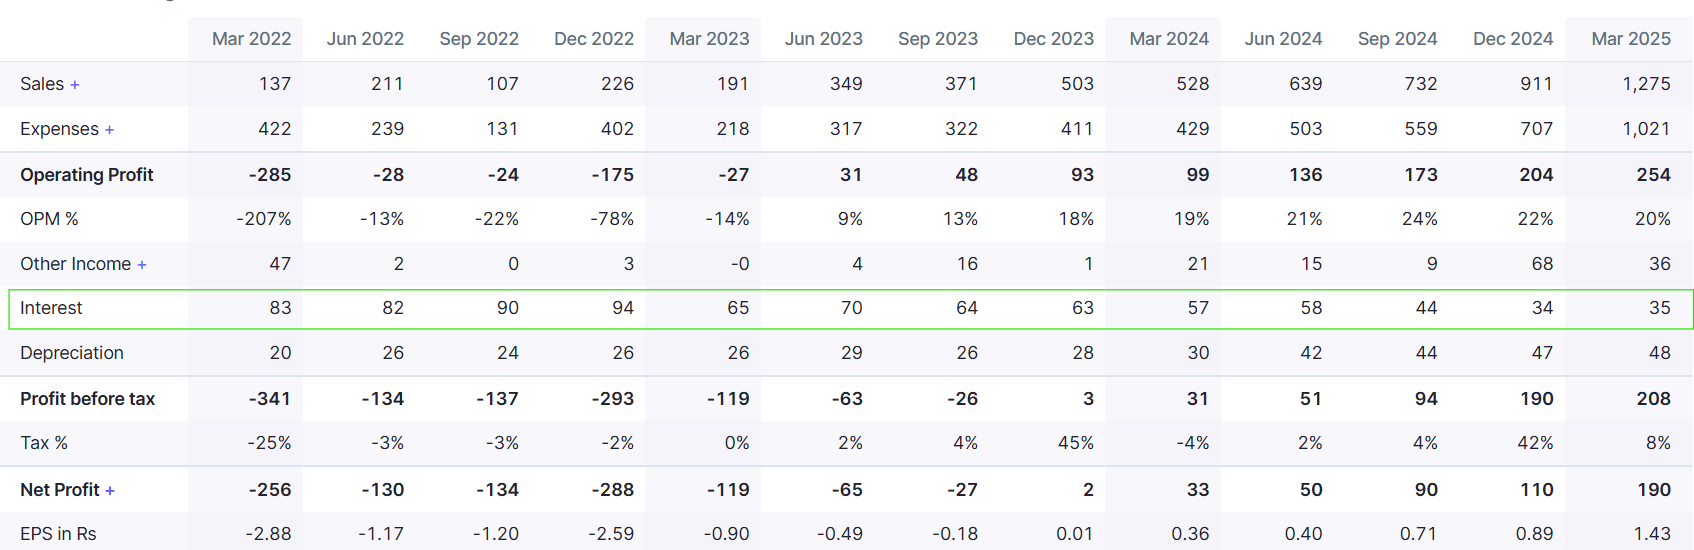
Inox Wind went through an intense capex phase between FY22–FY24, reflected in high fixed asset purchases and negative operating performance. However, as new manufacturing capacity went live and interest costs fell, profitability returned sharply in FY24 and FY25. Additionally, industry tailwinds—such as increasing focus on renewable energy—further supported the turnaround. This highlights the classic post-capex operating leverage story amplified by a favorable external environment.
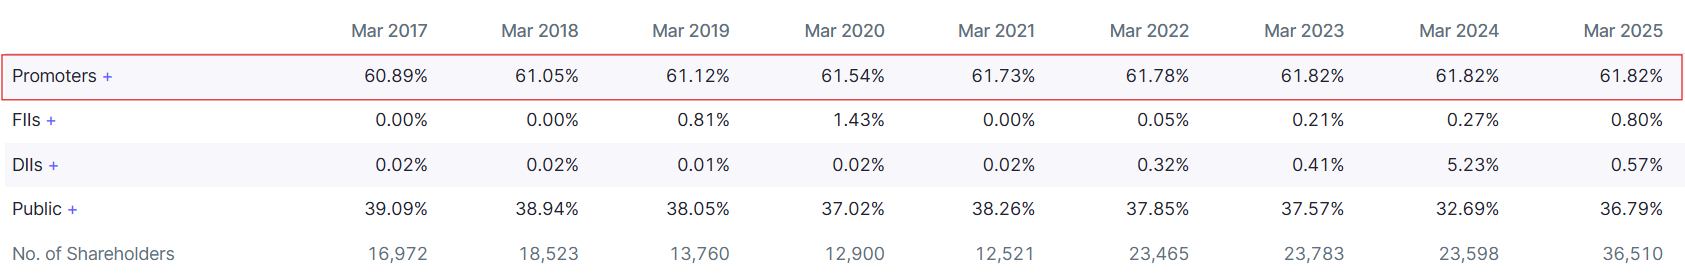
5. Increasing Promoter Holding (without red flags)
In microcaps, promoters often provide clearer insights than financial statements because they are deeply involved in the day-to-day operations and long-term strategy. Their actions—like increasing stake or participating in buybacks—can signal confidence, insider knowledge, or alignment with shareholder interests, often before it's reflected in financial numbers.
Why it matters:
Insider confidence.
Reduced floating stock leads to higher scarcity and potential stock appreciation.
Real-World Example:
Pix Transmission is a compelling example. Between FY17 and FY25, promoter holding gradually increased from 60.8% to 61.82%, indicating steady confidence in the company’s long-term prospects. This accumulation coincided with strong business growth and operating performance, reinforcing that promoter actions often lead the fundamentals.
Red Flag: Watch out for promoter pledging or sudden share dilution—these negate the positive signal.
Bonus Tip: Combine Everything into One Powerful Screener Query
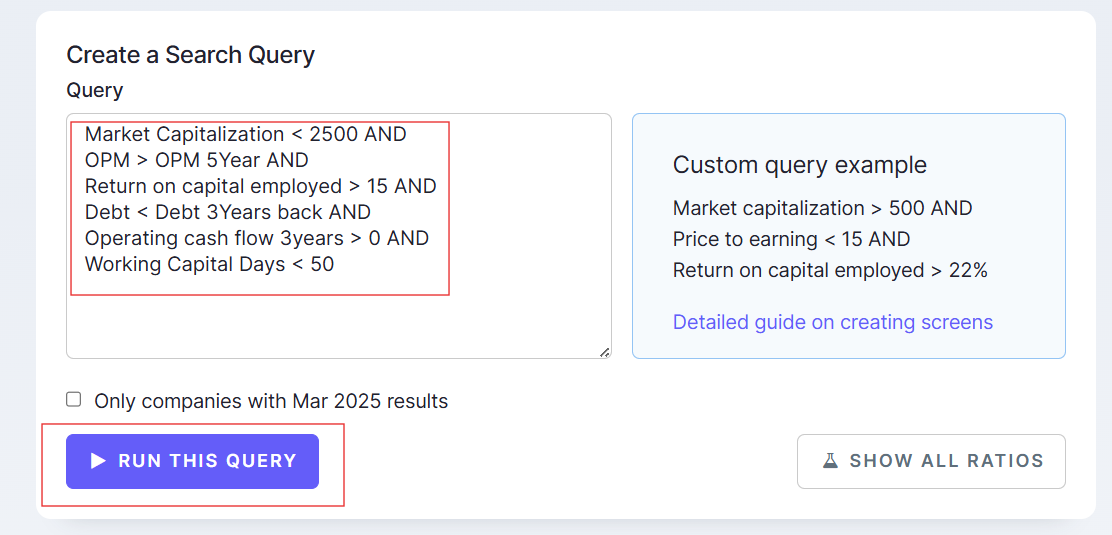
Here's a quick custom query to uncover hidden microcap gems:
Market Capitalization < 2500 AND
OPM > OPM 5Year AND
Return on capital employed > 15 AND
Debt < Debt 3Years back AND
Operating cash flow 3years > 0 AND
Working Capital Days < 50
This typically yields around 50–60 under-the-radar companies. If you want a larger list, you can choose to ignore the Working Capital Days filter.
Where to create this screen on Screener.in:
Go to the Screener.in homepage.
Click on the “Screens” tab in the top menu.

Then click “Create New Screen” on the right-hand side.
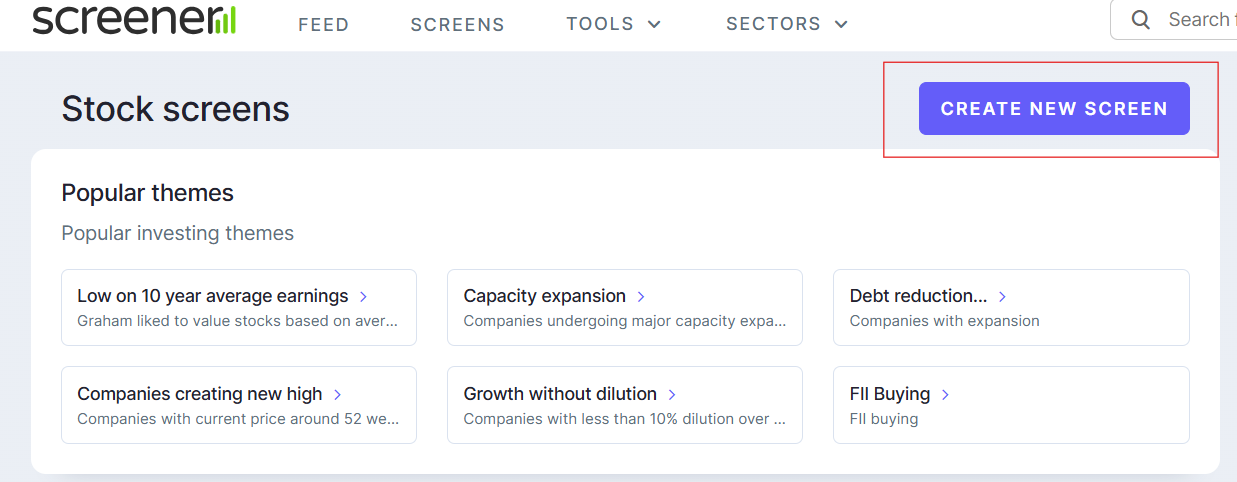
Paste the query into the editor and hit Run This Query.


Once saved, Screener will give you a list of companies that meet custom criteria—updated in real time.
Final Thoughts
Finding great microcaps isn't just spotting cheap stocks—it's about identifying strong underlying businesses, efficient capital usage, and signals from promoters or insiders. Screener.in can be your secret weapon in this hunt, but only if you know what traits truly matter and how to filter for them.
Have you used any of these filters before? Or do you have a go-to metric or Screener filter that’s helped you find a winner?
Let me know in the comments—I'd love to hear what’s worked for you.
If you found this useful, consider subscribing—I share more microcap insights like this every week.
And just to keep it real: the stocks mentioned here are for learning purposes only, not a buy or sell recommendation.
This is really wonderful. Thank you so much for sharing.
Superb , practical and to the point sir